In March of 2021, Denmark announced that that they had approved the construction of an artificial island to supply offshore wind power. The island will collect power from offshore wind turbines to transform and transmit it to the Danish electrical grid. The first stage won’t be operational until 2033. A huge project like this will probably have an overall project director, and an army of project managers working on the pieces of the puzzle. Although project management is waste by definition, it is also the epitome of necessary waste for a massive infrastructure project like this.
But this project also has a lot of unknowns. It’s the first time anything like this has been attempted. The group needs solutions that have not yet been invented. If the team attempts to run the entire project with traditional project management tools, they are likely to disappoint. According to researchers at Oxford University, large-scale projects like this have only a 0.2% chance of being delivered on time, on budget with the expected performance.
Traditional project management methods can lead a team to failure in the early stages of programs like this. They weigh down the project with inflexible schedules that are either out-of-date or difficult to maintain, when they most need agility to respond to new information.
Traditional Project Management is a Toolkit Designed
for Large Transactional Projects
The Project Management Institute’s Project Management Body of Knowledge defines no fewer than 47 project management processes, grouped into five Process Groups: Initiate, Plan, Execute, Monitor / Control and Close. Each of the core processes may have one to many tools associated with it. The PMBOK book itself is 589 pages long.
This may sound like a lot of material, but if you are building a new skyscraper, a battleship or a 3-gigawatt energy island, you’ll need every one of these processes to get the project off to a good start and then execute it well. These types of projects have these things in common:
The technology is well-understood. There may be some innovative use of materials, for example but 90% or more of the project does not require the team to create new knowledge. In product development, we seek to do what’s never been done before.
The project has many interlocking parts with a lot of dependencies – but the dependencies are already well-understood and the sequence of work does not change. In product development, we build our dependency networks as we make decisions.
The most important problems to solve are to ensure that the project tracks closely to budget and schedule, and to understand the impact on the whole program when a subcontractor is late or runs over budget. We have these challenges in product development as well, but the major challenge is to make good decisions that lead to a great product.
Once the project plan has been signed off by the customer, changes to the project specs are discouraged and may even be impossible. Any changes that do occur may require multiple layers of sign-offs to ensure that everyone agrees to accept the impact to the schedule and the budget. Development teams that try to lock down requirements this way quickly learn that customers are not often capable of giving perfect requirements for something they’ve never seen.
Most product development organizations don’t even try to implement the entire set of processes, because if they did, the programs would collapse under the weight of all the overhead. Instead, they focus the project manager on managing scope, schedule and budget – the so-called “Iron Triangle” of project management. Teams often use three specific tools to help them manage schedule.
Schedule Management Tools Often Cause Trouble
Among the tools for managing scope, schedule and resources, it’s the scheduling tools that cause the most trouble. The tools for managing scope and budget can vary a lot by project, but the schedule management tools often look the same, thanks to the ubiquity of Microsoft Project®. Here are the three tools I see most often:
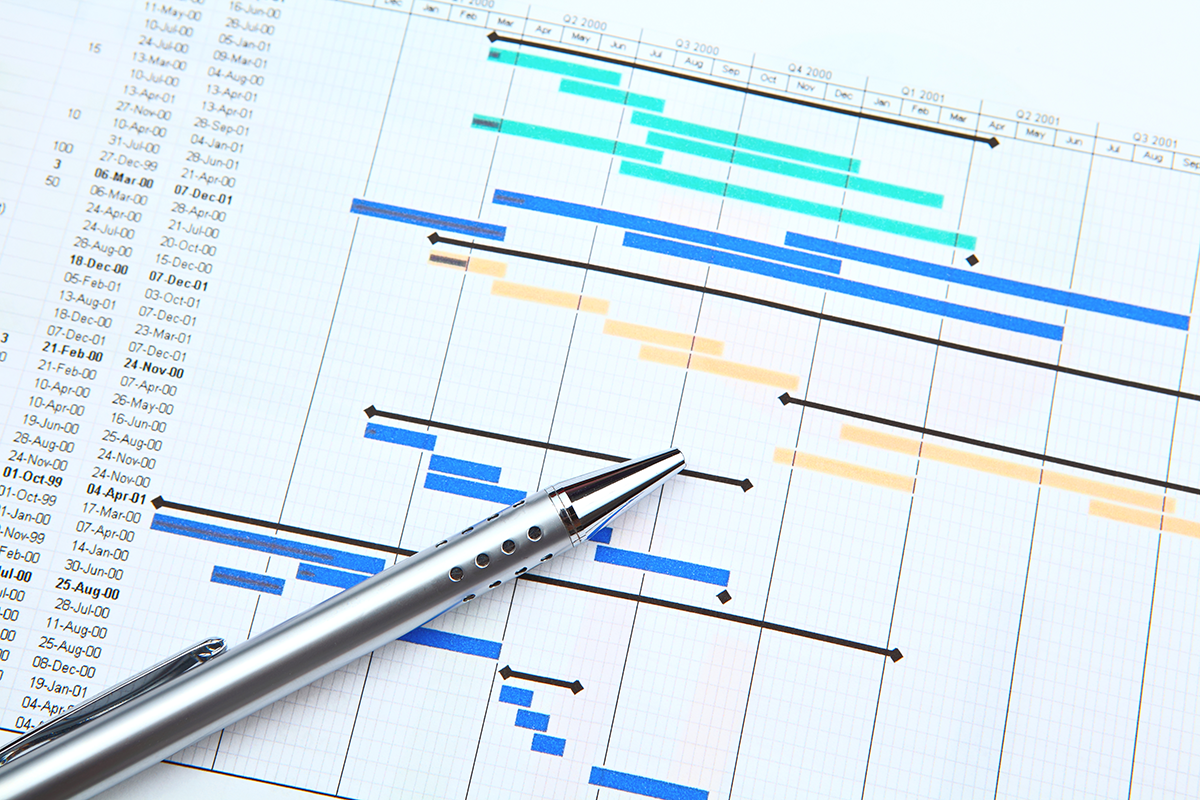
- The Gantt Chart: As the example above shows, the Gantt Chart is a visual model of the project’s schedule. It displays tasks in a column on the left, and a timeline running across the top. Bars show the duration of a task, and arrows show dependencies between tasks.
- The Pert Chart / Work Breakdown Structure: PERT stands for Project Evaluation and Review Technique. It’s a much simpler way to represent the dependencies between activities in a project. We represent Activities as boxes, with arrows between them to indicate the dependencies.
- Critical Path Analysis: This is a review of the project to understand the Critical Path – the longest sequence of activities from start-to-finish. Items on the Critical Path will delay the project if they are late. Items that are not on the Critical Path may slip a little, as long as they don’t slip so far that they impact the next item on the Critical Path.
All three of these tools have their uses within a product development organization – but probably not in the same way that you are using them today – because they get out of date too quickly and require too much overhead to keep in sync with the product’s current state.
Agile Project Management Supports Decision Making in a Dynamic Environment
In the late 1990s the software development community ran up against two problems that stressed traditional project management tools to the breaking point: the Y2K bug and widespread adoption of the Internet. A massive effort went into fixing software systems so that they could handle the change from 19xx to 20xx. It was easy to predict where some fixes needed to be made, but groups also had to run a lot of compliance tests that could lead to unexpected results. Since no one knew exactly where things needed to be fixed, it was difficult to put together a predictable plan – even though teams had the unyielding deadline of January 1, 2000.
The Internet also changed how teams developed software. In the beginning the technologies that ran the Internet on the server side and in the browser were immature and evolving rapidly. A team could develop a credit card processing toolkit only to find that it needed to be rewritten six months later when the underlying technology was updated. Most consumers were using the Internet for the first time and so they did not have the ability to give good feedback on user interfaces for online banking systems, shopping carts and image galleries.
Agile Project Management addressed these challenges by running lightweight project plans that teams developed and maintained together, and that did not require specialized tools. First, they are intentionally easy to change, so they don’t assume or convey more certainty than the team has. Then they are easy to change when necessary. Since the engineers, scientists and marketing professionals populate the plan, it’s the team’s plan – not the manager’s plan. Finally, a well-designed Visual Project Plan makes problems visible – they literally have no place to hide.
Multilevel schedules with rolling windows help the teams manage the changes by planning only the appropriate time frame for different levels of detail: the entire project for major milestones, the next few months for major decisions, and the next few weeks for activities. The plan doesn’t get ahead of itself.
Teams originally built these plans on whiteboards with sticky notes. Today, some good options have emerged for building these types of plans in virtual space and then storing them in the cloud. Some of these can even turn a visual plan into a Gantt chart, although the work required to set up the dependencies is probably not worth it for most teams in early development.
Don’t delete Microsoft Project® yet!
When a team moves into Execution mode, it starts to capture its decisions in final deliverables and perform broader validation tasks that do have dependencies. That’s the part of product development when these tools start to make sense: fewer changes, especially if the team has used Rapid Learning Cycles to make good Key Decisions that prevent late-found problems, dependency structures that are known and not likely to change and more focus on schedule to get the first products produced and sent into distribution.
Denmark’s energy island probably already has a good high-level Gantt chart to show how they will build these wind turbines on time, but given the uncertainty and risk they face, they may want to consider some Rapid Learning Cycles on the most uncertain parts of the project.